Chapter 1: Mathematical Comparison: t-test vs TOST
1. t-test: Testing for Difference
In a standard two-sample t-test, we assess:
- Null Hypothesis (H₀): μ₁ = μ₂ (no difference)
- Alternative (H₁): μ₁ ≠ μ₂ (there is a difference)
The test statistic:
\[ t = \frac{\bar{X}_1 - \bar{X}_2}{s_p \cdot \sqrt{\frac{1}{n_1} + \frac{1}{n_2}}} \]
with pooled standard deviation \(s_p\), follows a t-distribution. We reject H₀ if \(|t| > t_{α/2}\).
Key limitation: If p > 0.05, it only means no evidence of difference, not evidence of similarity.
2. TOST: Testing for Equivalence
In TOST, we define equivalence bounds: \([-Δ, +Δ]\), where Δ is the maximum acceptable difference.
TOST is performed:
- \(H₀: μ₁ - μ₂ ≤ -Δ\) vs \(H₁: μ₁ - μ₂ > -Δ\)
- \(H₀: μ₁ - μ₂ ≥ +Δ\) vs \(H₁: μ₁ - μ₂ < +Δ\)
We reject both H₀’s if the (1–2α) confidence interval for \(μ₁ - μ₂\) is entirely within \([-Δ, +Δ]\).
Visualization: Equivalence is demonstrated if the CI ⊂ [-Δ, +Δ]
3. Simulation: t-test vs TOST
We conducted 10,000 simulations across a range of sample size (n = 2 to 100 ) to evaluate the following:
- Random sampling from two groups with different means
- Comparison of those sample means to determine whether a difference is detected
- The correct conclusion in all cases: tho two group means are different.
Estimation of the probability of a correct conclusion, defined as correctly identifying that the two group means are different, using two statistical approaches: t-test and TOST
Key Results
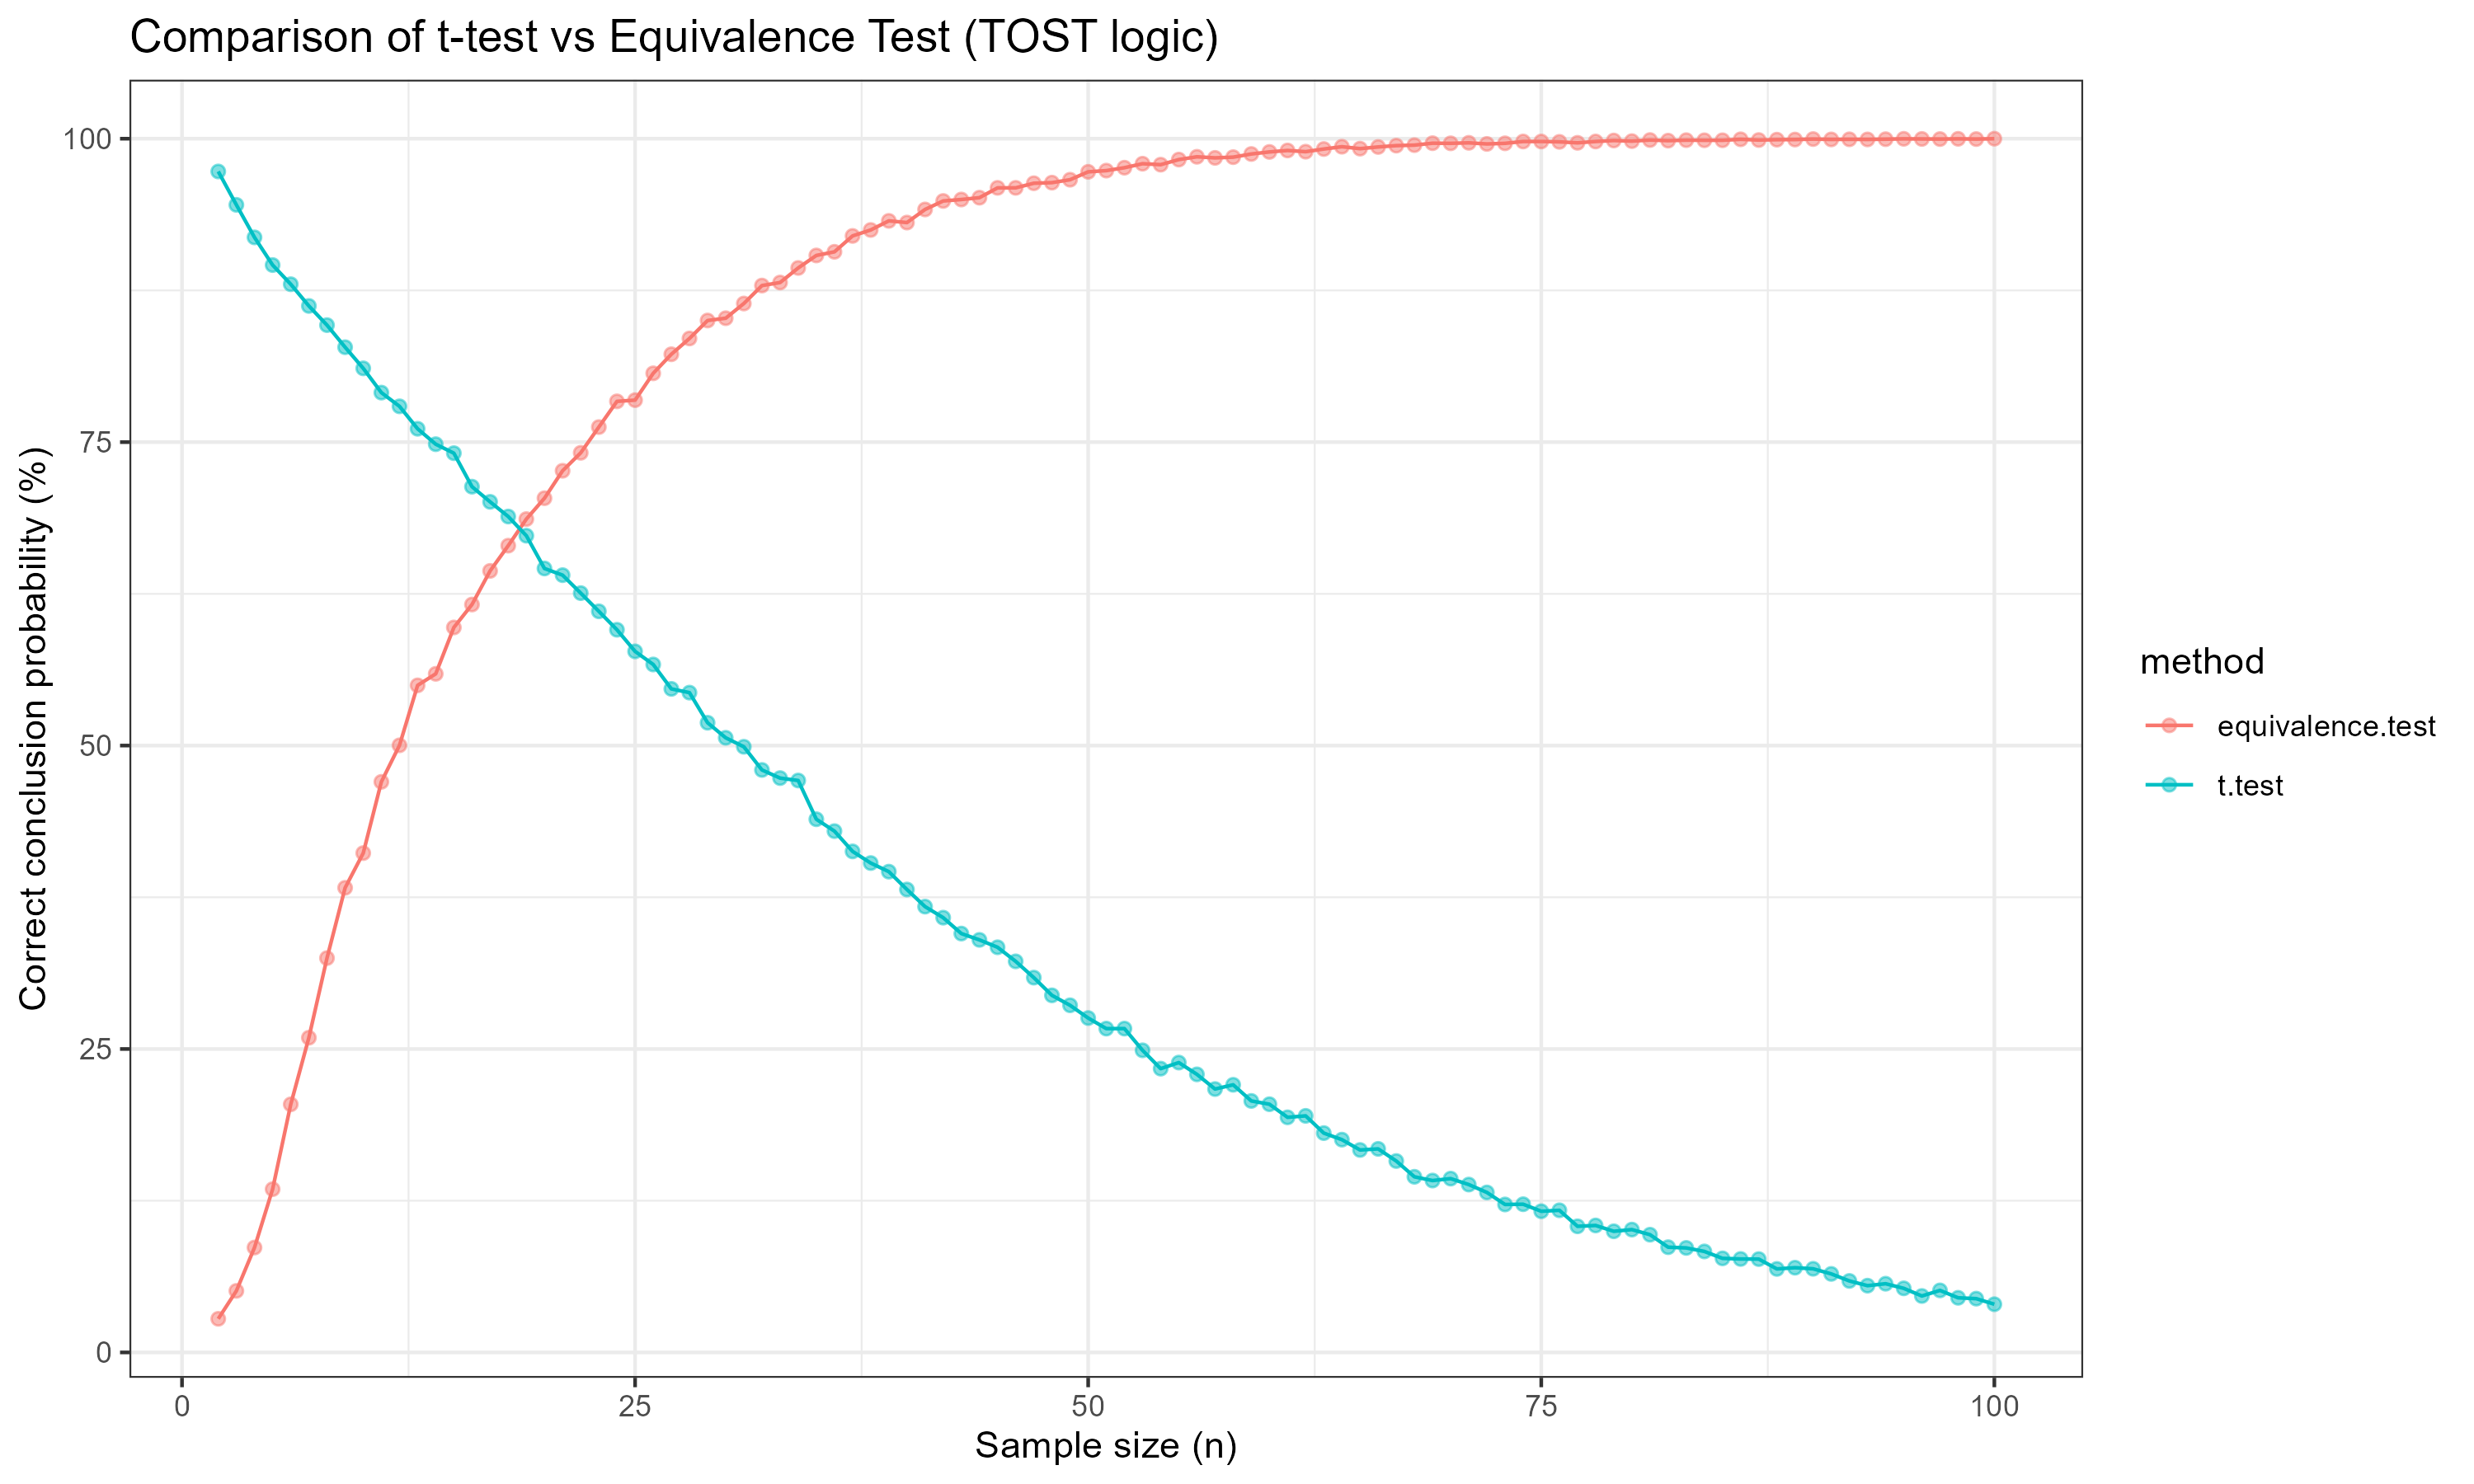
t-test: Designed to detected differences, but in simulations, it often fails to detect small true difference when sample size increases, leading to a false sense of equivalence. This effect worsens as the sample size increases due to narrowing confidence intervals centered near zero, especially when the true difference is small.
TOST: Designed to test for equivalence. As sample size increases, TOST becomes more likely to correctly reject equivalence when the means differ, reaching near-perfect accuracy beyond n ≈ 60.
Insight: A non-significant t-test does not imply equivalence. In fact, t-test becomes less reliable at detecting small true differences as sample size increases, while TOST correctly rejects equivalence with increasing sample size. Equivalence requires a dedicated test, and TOST fulfills that purpose.
4. Code used for the Simulation
library(parallel)

# Parallelized t.test simulation
sim_ttest <- function(target_n, g1, g2, reps = 10000) {
  cl <- makeCluster(detectCores() - 1)
  clusterExport(cl, varlist = c("g1", "g2", "reps"), envir = environment())
  n_vec <- 2:target_n
  results <- parSapply(cl, n_vec, function(i) {
    mean(replicate(reps, {
      g1.s <- sample(g1, i)
      g2.s <- sample(g2, i)
      t.test(g1.s, g2.s)$p.value > 0.05
    }))
  })
  stopCluster(cl)
  data.frame(n = n_vec, probability = results * 100)
}

# Parallelized TOST-like CI check
sim_tost <- function(target_n, g1, g2, margin, reps = 10000) {
  cl <- makeCluster(detectCores() - 1)
  clusterExport(cl, varlist = c("g1", "g2", "margin", "reps"), envir = environment())
  n_vec <- 2:target_n
  results <- parSapply(cl, n_vec, function(i) {
    mean(replicate(reps, {
      g1.s <- sample(g1, i)
      g2.s <- sample(g2, i)
      diff <- mean(g2.s) - mean(g1.s)
      sd1 <- sd(g1.s)
      sd2 <- sd(g2.s)
      se <- sqrt(sd1^2 / i + sd2^2 / i)
      df <- ((sd1^2 / i + sd2^2 / i)^2) /
            ((sd1^4) / ((i - 1) * i^2) + (sd2^4) / ((i - 1) * i^2))
      t_crit <- qt(0.95, df)
      lci <- diff - t_crit * se
      uci <- diff + t_crit * se
      (lci > -margin) & (uci < margin)
    }))
  })
  stopCluster(cl)
  data.frame(n = n_vec, probability = results * 100)
}


# Set seed and simulate
set.seed(0815)
g1 <- rnorm(1000, 0.8987491, 0.3197588)
g2 <- rnorm(1000, 1.098018, 0.4273691)
margin <- 1.5 * sd(g1)

result_ttest <- sim_ttest(100, g1, g2)
result_tost <- sim_tost(100, g1, g2, margin)

# Combine and plot
library(ggplot2)
result_ttest$method <- "t.test"
result_tost$method <- "equivalence.test"
df_plot <- rbind(result_ttest, result_tost)

ggplot(df_plot, aes(n, probability, color = method)) +
  geom_point(alpha = 0.5) + geom_line() +
  theme_bw() + xlab("Sample size (n)") +
  ylab("Correct conclusion probability (%)") +
  ggtitle("Comparison of t-test vs Equivalence Test (TOST logic)")